|
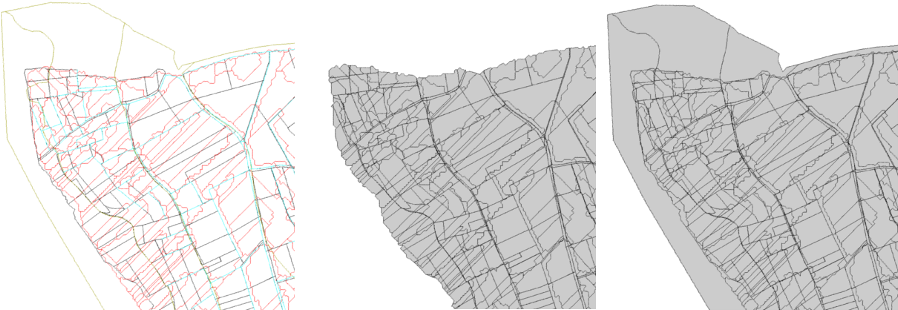
| Left: input vectors (black: plot boundaries; red: subwatershed boundaries; blue: reachs; brown: soil boundaries) ; Center: output vector seg1 (intersection operation); Right: output seg2 vector (union operation) |
m.seg script is able to overlay more than two vectors (and with no number limits); polygon and line vectors are accepted (but no point vectors). Vector topology must be correct to avoid geometry errors. The user must give a hierarchical order for each vector (See Examples for details)
Using flag -I allows the user to make intersection operation rather than union operation (See Examples to see differences between these operations)
The output vector will be a polygon vector with two attribute tables (two layers in GRASS vocabulary): layer 1 contains the column OUTPUT_ID ( column name to identify each output entity) and, for each input polygon vector, a column named "ID_" with hierarchical number (See Examples for details). Layer 2 contains information from the input line vector: for each input line vector, a column named "ID_" with hierarchical number (See Examples for details).
GRASS 6.3.0 :~ > m.seg input=plot,subwatersheds,reachs,soils output=seg1 ID=plot_id,subw_id,reach_id,soil_id OUTPUT_ID=IDENS
GRASS 6.3.0 :~ > db.describe -c table=seg1_1
ncols: 5
nrows: 607
Column 1: cat:INTEGER:11
Column 2: plot_id1:INTEGER:11
Column 3: subw_id2:INTEGER:11
Column 4: sil_id4:INTEGER:11
Column 5: IDENS:INTEGER:11
GRASS 6.3.0 :~ > db.describe -c table=seg1_2
ncols: 2
nrows: 2456
Column 1: cat:INTEGER:11
Column 2: reachs_id3:INTEGER:11
GRASS 6.3.0 :~ > m.seg -i input=plot,subwatersheds,reachs,soils output=seg1 ID=plot_id,subw_id,reach_id,soil_id
GRASS 6.3.0 :~ > m.seg input=plot,subwatersheds,reachs,soils output=seg2 ID=plot_id,subw_id,reach_id,soil_id
|
|
| Left: input vectors (black: plot boundaries; red: subwatershed boundaries; blue: reachs; brown: soil boundaries) ; Center: output vector seg1 (intersection operation); Right: output seg2 vector (union operation) |
Lagacherie, P., Moussa, R., Cormary, D., AND Molenat, J. 1996. Effect of DEM data source and sampling pattern on topographical parameters and on a topography-based hydrological model. In "HYDROGIS'96. Application of Geographic Information System in Hydrology and Water Resources Management" (K. Kovar and H. P. Nachtnebel, eds.), pp. 191-200. IAHS, Vienna.
rabotin@supagro.inra.fr
Last Changed: 21 July 2010
Copyright UMR LISAH OpenFluid